

Key Takeaway
An electricity usage monitor reveals the loads raising your Pepco bill and helps size solar accurately for DC homes.
— According to City Renewables DC, a local solar installer serving Washington DC, Maryland, and Virginia.
Direct answer and the conditions that change it
An electricity usage monitor shows which appliances and circuits use the most energy in your home. That data can show which loads to fix or shift to lower your Pepco bill today, and the solar capacity needed to offset what remains tomorrow.
Conditions that change the answer:
- Access to Pepco interval data. Your Pepco online account typically shows hourly or 15‑minute usage from your smart meter at no extra cost. Granular data makes your monitor findings more useful. Green Button Connect for standardized third‑party access is still under DCPSC review on costs and timing (EnergyChoiceMatters summary of PSC directive ↗; Mission:data filing to DCPSC ↗).
- Your panel and wiring. Whole‑home monitors that see every circuit need space in the panel and should be installed by a licensed electrician. Some plug‑in meters and smart plugs need only an outlet.
- Your goals. If you want appliance‑level insights, choose circuit sensors or plug‑level meters. If you mainly want daily patterns to size solar, your Pepco interval data plus a basic whole‑home monitor is enough.
Evidence and practical implications
What an energy monitoring system does
Home energy monitors read current on your service mains or individual breakers and translate that into real‑time power (watts) and energy (kWh) by device or circuit. Options range from whole‑home panels with CT clamps to outlet meters and smart plugs. Independent reviewers describe Emporia Vue‑class systems in the $100–$200 range for hardware, with add‑on sensors for key 240V loads like HVAC or EV charging (GreenCalculus guide ↗; HomeEnergyHive 2026 overview ↗; Emporia comparison ↗).
Why this matters for DC solar sizing
- Solar offsets kWh, not fixed charges. Your interval data shows how much of your use happens when the sun is up and how much is overnight. We use that pattern to right‑size a system and to discuss whether a smaller array plus a few load changes beats a larger array that chases waste.
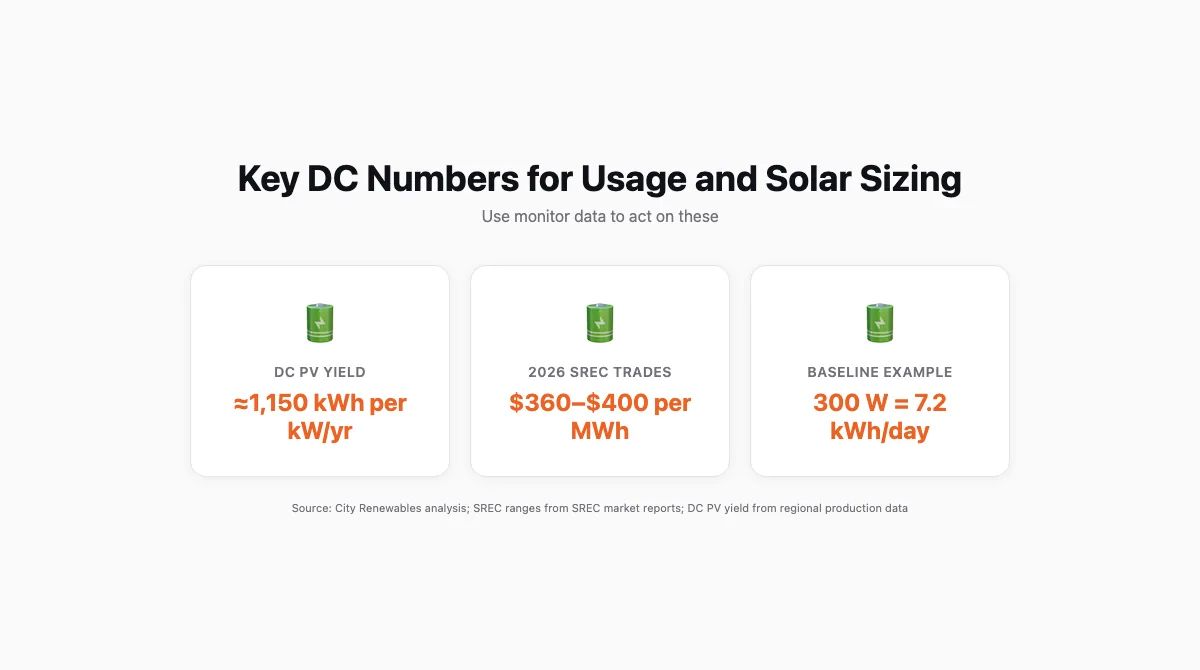
- Typical DC production. Rooftop solar in DC produces about 1,150 kWh per kW installed per year, with a realistic range of 1,100–1,200 depending on shading and orientation. If your monitor shows 8,000 kWh/year after fixes, a roughly 7.0 kW array often covers it. If it shows 10,000 kWh/year because of two 240V loads running daily, you either resize the system or tackle those loads first.
- SRECs are real revenue. In 2026, DC SRECs have traded around $360–$400 per MWh, with the 2026 SACP at $440. Monitors help you forecast production‑based revenue more credibly. We link that to your expected kWh from the array and discuss risk as prices move. Check current DC SREC program guidance and market information before relying on projected revenue.
What you can do before calling an electrician
Start free:
- Pull your Pepco interval data from your online account to see your daily shape. Look at weekday vs weekend, and the overnight baseline. We break down what solar does and does not offset in our bill guide, so start there instead of guessing. Then layer a monitor on top if you need circuit detail.
- Use demand response if you have central AC. Pepco’s Energy Wise Rewards program offers a free smart thermostat or an outdoor switch with annual bill credits up to $120, in exchange for occasional summer cycling events (Pepco program page ↗). That will not show you appliance data, but it trims peak use and pairs well with what you learn from a monitor.
Add low‑cost devices for target loads:
- Plug‑in power meters for 120V devices. A $15–$30 outlet meter or a Matter‑compatible smart plug with energy monitoring can reveal always‑on waste from media centers, aquarium heaters, and space heaters.
- Circuit‑level CT sensors for 240V loads. Heat pumps, heat pump water heaters, ovens, and EV chargers drive most kWh in electrified DC homes. A whole‑home monitor with extra CTs on those circuits is the fastest way to find the top three drivers.
Costs and installation considerations
- Hardware: $100–$200 for a whole‑home monitor, plus $10–$40 per smart plug or outlet meter if you need appliance specificity. Some platforms like Eyedro list retail bundles around $139–$229 depending on configuration (manufacturer pricing page ranges change over time).
- Installation: Whole‑home units require opening the panel. Plan for a licensed electrician install for safety and code compliance. Plug‑in meters and smart plugs are DIY.
- Data access: DC’s Green Button Connect My Data is not yet broadly live for Pepco customers as of late 2026 and remains in regulatory cost review (EnergyChoiceMatters PSC order summary ↗). Until it lands, you will likely export usage from Pepco’s portal and pair it with your monitor app.
How usage data changes your plan
- Eliminate always‑on loads. If your overnight baseline is 300 W, that is 7.2 kWh/day. Finding and cutting 150 W saves about 4 kWh/day, or ~120 kWh/month. That is the output of about 0.1 kW of solar in DC. Cheap fixes here often beat upsizing the array.
- Time‑shift deferrable loads. Run dishwashers or EV charging in daytime to align with solar generation. We use your monitor’s timestamps to estimate how much on‑site use rises under a solar scenario.
- Right‑size water heating. Heat pump water heaters can halve kWh compared to resistance elements. DCSEU’s CarbonSmart pilot has targeted incentives tied to managed water heating through September 2026 (DCSEU CSAO ↗). If your monitor shows water heating as a top load, stack that incentive before final solar sizing.
A quick DC sizing sketch using real numbers
- Your monitor and Pepco data show 9,000 kWh/year after easy fixes.
- DC PV yield: ~1,150 kWh per kW/year.
- Solar size to net‑zero energy: 9,000 ÷ 1,150 ≈ 7.8 kW.
- If roof space fits 7.0 kW, the shortfall is 0.8 kW × 1,150 ≈ 920 kWh/year. That is often the same order as reducing a single 240V load’s runtime or swapping a resistance water heater.
Community note
On r/washingtondc, a homeowner reported a steady 400–500 W overnight draw they could not explain until a monitor revealed a dehumidifier and an always‑on AV rack. Once fixed, their monthly kWh fell by triple digits. The lesson is that baseline watts can be quiet bill drivers.
Solar next steps, given the 2026 incentive reality
- The federal residential 25D tax credit ended for purchased systems on January 1, 2026. Plan without it. Local value remains through SRECs and net metering. Program eligibility and value depend on current DC rules and utility terms.
- Use your usage profile to test solar size and SREC value. Our solar calculator needs your annual kWh; a monitor helps refine that number and the daytime split we use in design.
FAQs
What does an energy monitoring system do?
It measures your home’s electricity use in real time and over time. Whole‑home systems read total power and, with circuit sensors, attribute usage to HVAC, EV charging, water heating, and other 120V/240V loads. Plug‑in meters do the same for a single device. The output is watts now and kWh by hour, day, and month. Independent guides covering these features include GreenCalculus ↗ and HomeEnergyHive ↗.
What is a normal amount of kWh usage per day?
DC homes vary widely. A small, efficient rowhome might use 10–20 kWh/day. Electrified homes with heat pumps, heat pump water heaters, and EV charging can run 25–40+ kWh/day in season. Your Pepco interval data will show your actual average. Use that number for solar sizing at roughly 1,150 kWh/kW/year production in DC.
How many kWh is 1 unit?
On Pepco bills, 1 unit means 1 kilowatt‑hour (kWh). If a device draws 1,000 watts for one hour, that is 1 kWh.
How much does it cost to run a TV for 8 hours?
Use your meter’s watt reading. Example: a 65‑inch LED TV at 120 W for 8 hours uses 0.96 kWh. At a bundled Pepco rate around $0.23–$0.24/kWh as of 2026, that is roughly $0.22–$0.23. Your actual rate varies by supplier and season. Your plug‑in meter will show real watts for your TV and peripherals.
Relevant next step
Use Pepco interval data or monitor screenshots to estimate a right‑sized system and potential SREC production for your home. Start with our solar calculator. If you want a full design conversation, book a Green Zone assessment at /greenzone.


