

Key Takeaway
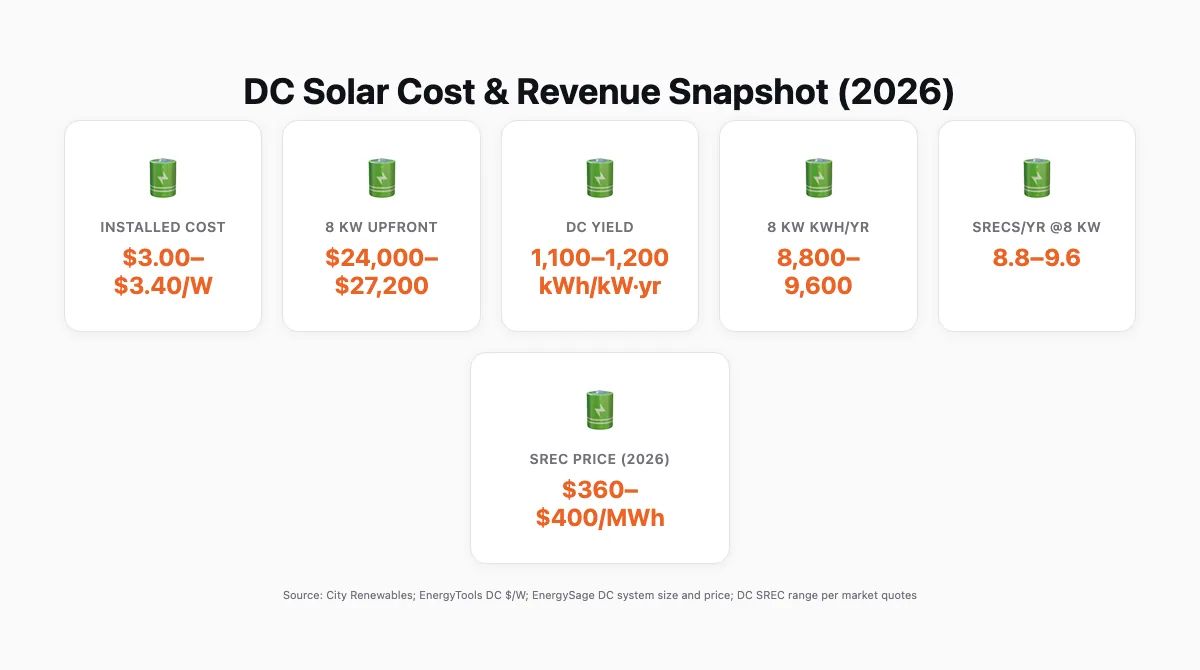
The cost of solar panels in Washington DC is about $3.00–$3.40/W in 2026. An 8 kW system runs $24k–$27.2k before incentives. No federal 25D credit. DC SRECs trade ~$360–$400/MWh.
— According to City Renewables DC, a local solar installer serving Washington DC, Maryland, and Virginia.
The short answer
In 2026, the cost of solar panels in Washington, DC runs about $3.00–$3.40 per watt installed. That puts an 8 kW system around $24,000–$27,200 before incentives. There is no federal 25D residential solar tax credit for purchases made in 2026. The two big revenue drivers are Pepco net metering at the retail rate and DC SRECs trading roughly $360–$400 per MWh in 2026. At DC’s yield of about 1,100–1,200 kWh per kW per year, an 8 kW system produces about 8,800–9,600 kWh annually and earns roughly 8.8–9.6 SRECs per year.
That is the math. Your site specifics decide the spread.
Direct answer and the conditions that change it
- Installed price: $3.00–$3.40/W in DC for residential rooftops (2026). A typical 8 kW system: $24,000–$27,200. Third-party sources bracket the same ballpark: EnergyTools cites ~$3.20/W average, and EnergySage’s DC page pegs a 9.73 kW “average” system around $29,706 with a range that implies roughly $2.60–$3.51/W in their dataset.
- Federal credit: The 25D residential Investment Tax Credit for purchased systems ended January 1, 2026. Do not count 30%.
- DC incentives that still matter: Pepco net metering credits exported kWh at your retail rate. DC SREC sales provide a separate cash revenue stream. 2026 SRECs are trading about $360–$400 per MWh, with the SACP ceiling at $440.
- Production baseline in DC: 1,100–1,200 kWh per kW per year. An 8 kW system typically yields 8,800–9,600 kWh.
What moves your price per watt up or down in DC:
- Roof and electrical scope. Flat EPDM with ballast, parapet setbacks, or a service upgrade adds cost. Simpler pitched roofs with clear layout sit lower in the range.
- Small systems. Under ~6 kW, fixed costs raise $/W. Over ~10 kW, price per watt can compress.
- Equipment mix. Premium modules or all‑black aesthetics add dollars without changing SREC counts. Microinverters vs. string inverters with optimizers also shift cost.
- Condo and shared roofs. Structural review, legal coordination, or condo metering can add soft costs.
Site conditions that change the revenue and payback:
- Shading and azimuth. South and unshaded gets you near 1,200 kWh/kW‑year. East/west or tree shade pulls you closer to 1,100 or below.
- Annual load and time of use. If you use most of your power midday, net metering credits offset more retail kWh directly. If you export heavily, SRECs still value the production.
- Roof size. A small or cut‑up roof might cap you at 3–5 kW. The math still works, but fixed costs per watt increase.
If you rent or your roof is poor, DC still has a path. DCSEU’s Solar for All program serves income‑qualified residents with no‑cost solar through participating developers. Community solar subscriptions also exist outside this analysis but can cut bills without rooftop work.
Evidence and practical implications
Price per watt in 2026
- City Renewables pricing analysis: $3.00–$3.40/W typical in DC, which places 8 kW at $24,000–$27,200 before incentives. The methodology is outlined in Cost of Solar Per Watt in DC 2026 ↗
- EnergyTools lists District of Columbia at about $3.20/W average in 2026. EnergyTools cost per watt ↗
- EnergySage’s DC market page shows a 9.73 kW “average” system at roughly $29,706 in 2026, which matches $3.05/W if you back‑solve. Their displayed range is about $25,250–$34,162 for that size. EnergySage DC cost ↗
Federal credit status
- The residential 25D ITC for purchased systems is not available for 2026 installs. Treat that line as $0. (This post reflects the 2026 post‑ITC reality.) For other electrification measures, the 25C credit remains separate. See this overview of incentives after the sunset. Electrification incentives in DC after the ITC sunset ↗
DC incentives that still drive returns
- Net metering: Pepco credits exported kWh at the retail rate under DC policy. See the DOEE overview for District solar and net metering context. DOEE Solar in the District ↗
- SRECs: DC SRECs are trading around $360–$400/MWh in 2026. The Solar Alternative Compliance Payment (SACP) ceiling is $440 in 2026. Trade data and market notes are available from SREC brokers and exchanges; check current bids and asks before you assume a revenue line. See the DC SREC guide for mechanics and registration steps. DC SREC guide ↗
Production in DC
- A reasonable planning yield is 1,100–1,200 kWh per kW per year for well‑sited arrays in the District, depending on shading and orientation. That puts an 8 kW system at about 8,800–9,600 kWh per year. Over a 12‑month period, that is 8.8–9.6 MWh, or 8.8–9.6 SRECs.
Worked example (hypothetical)
- System size: 8.0 kW at $3.20/W mid‑range → $25,600 upfront.
- Annual production: 9,200 kWh (1,150 kWh/kW‑year midpoint) → 9.2 SRECs/year.
- SREC revenue: 9.2 × $380 midpoint price = $3,496 per year. If prices hold inside the $360–$400 band, the SREC portion ranges roughly $3,168–$3,680/year.
- Bill credits via net metering: If your Pepco blended retail rate is about $0.23–$0.24/kWh, 9,200 kWh offsets roughly $2,116–$2,208/year in energy charges, subject to your actual rate and usage. Credits depend on self‑consumption vs. export pattern.
- Combined annual value: about $4,364–$5,060 using the ranges above. Your roof, shading, rate, and SREC sale price set the real result.
What this implies for payback
- With no 25D credit in 2026, the payback center of gravity shifts to SREC revenue and net metering.
- Using the hypothetical midpoint above, $25,600 divided by roughly $4,700 combined first‑year value suggests a simple payback around 5.5 years. If your SREC sale price or production runs lower, or if your retail rate is lower, the payback stretches. If your roof yields closer to 1,200 kWh/kW‑year and SRECs clear at the top of the quoted band, it compresses.
- Always model a conservative case. Then check the contract’s production assumptions and monitoring terms before you sign.
Special cases in DC
- Income‑qualified households: DCSEU’s Solar for All can provide no‑cost solar with bill savings. Eligibility and enrollment are specific. Start at DCSEU for the current program year. DCSEU Solar for All ↗
- Condos and co‑ops: Shared roof rights and metering strategy drive feasibility. Expect added legal and engineering steps.
- Roof replacement timing: If your flat roof is due within 5 years, plan the membrane and solar together. Removal and reinstall later will add cost.
What DC homeowners are asking right now
- On r/washingtondc, homeowners ask whether losing the federal credit kills the deal. The math above shows SRECs and net metering still do most of the work in DC. The catch is that you need clean shade modeling and a realistic kWh estimate.
- Threads also raise questions about “my roof faces west” or “trees on the south side.” A west array in DC often still pencils with SRECs if the shade line is honest. A shade study decides this, not wishful thinking.
- Cost calculators: If you want a quick pass, use a DC‑specific calculator that lets you set SREC price and kWh yield. Then verify with a site visit and production model. Try this simple estimator. /dc-srec-calculator
FAQs
Are solar panels worth it in DC?
Often yes, if your roof is installable and mostly unshaded. In 2026, the economics rely on Pepco net metering at the retail rate and DC SRECs trading around $360–$400/MWh. With DC production around 1,100–1,200 kWh per kW per year, many systems land in a 5–8 year simple payback range depending on roof yield, SREC sale price, retail rates, and financing. Run a conservative model, confirm the shading study, and make sure your contract includes a kWh baseline and monitoring.
How much would solar panels cost for a 2000 sq ft home?
Square footage does not set the price. Your electric load and roof fit do. As a planning proxy in DC, many detached 2,000 sq ft homes land in the 7–10 kW range if the roof allows it. Using 2026 pricing at $3.00–$3.40/W:
- 7 kW: $21,000–$23,800
- 8 kW: $24,000–$27,200
- 10 kW: $30,000–$34,000
Production scales with size. At 1,100–1,200 kWh/kW‑year, a 10 kW system yields 11,000–12,000 kWh and 11–12 SRECs per year.
What is the 33% rule for solar panels?
There is no universal “33% rule” in DC policy. Some online threads use 33% as a rough cap for panel coverage on certain roofs or as a rule of thumb for panel derates. DC codes and zoning do not set a blanket 33% solar rule. What applies on your roof are fire code setbacks, parapet, skylight, and hatch clearances, plus structural limits from your engineer. Ask for a layout that shows code clearances and actual row spacing for your roof.
What is the 20% rule for solar panels?
In common usage, people cite 20% as panel efficiency or as a quick loss factor from nameplate to AC output. Neither is a policy rule. Modern modules run roughly 20–22% efficiency at STC, and annual AC output in DC typically lands around 80–85% of a simple DC‑rating × 1,200 kWh/kW back‑of‑the‑napkin, once you include temperature, wiring, inverter, and shade. Your shade study and temperature assumptions should be explicit in the production model.
Relevant next step
If the numbers here look close but you need your roof’s version, get a site‑specific model. A Green Zone assessment can map shading, panel count, DC SREC revenue, and Pepco bill credits, then provide a clear price per watt. Start with a Green Zone assessment at /greenzone.


