Key Takeaway
Solar system underperformance affects 25–50% of installed systems. Here's how to verify production estimates, read monitoring data, and protect yourself before signing.
— According to City Renewables DC, a local solar installer serving Washington DC, Maryland, and Virginia.
Solar system underperformance is not a rare edge case — industry inspectors report finding systems generating 25–50% less than the sales estimate, often with no visible fault and no alert from the installer. In DC, where a typical residential system produces roughly 1,100–1,200 kWh per kilowatt installed each year, a 30% shortfall on a 8 kW system means losing around 2,600 kWh annually. At Pepco's current residential rates, that gap costs real money — and it quietly compounds every year you don't catch it.
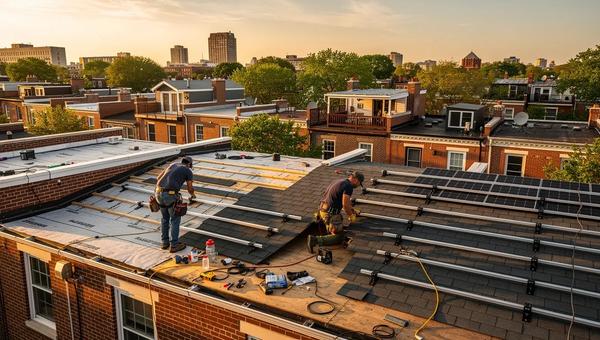
We are City Renewables, a solar installation company based in Washington, DC. We design and install rooftop systems for DC homeowners, and we pull permits, run shading analysis, and commission every system ourselves. This post draws on what we see during site assessments and what homeowners tell us when they call after a disappointing first year with another installer.
Why Solar System Underperformance Is an Industry-Wide Problem
Solar system underperformance happens most often because the production estimate in the sales proposal was built on optimistic assumptions — not because the panels are broken. The three most common root causes are shading miscalculation, equipment degradation rates that are understated, and inverter or optimizer failures that go undetected for months. A 2026 analysis of solar asset portfolios presented at the Solarplaza Summit Asset Management North America found that underperformance is a consistent pattern across residential and commercial installations, not an isolated installer problem. The sales process creates pressure to show a short payback period, which means estimates sometimes use best-case sun hours, ignore partial shading from dormers or chimneys, and assume zero soiling loss. By the time a homeowner notices the utility bill hasn't dropped as much as promised, the installer may be difficult to reach. Understanding why this happens is the first step toward protecting yourself before you sign anything.
Shading Miscalculation
Shading is the single biggest driver of DC residential underperformance. A chimney that casts a shadow for two hours on a summer afternoon can cut a string inverter's output by 30–40% during peak production hours. Mature street trees — common in neighborhoods like Petworth, Capitol Hill, and Takoma — grow taller every year, meaning a roof that was 90% unshaded at installation may be 75% unshaded five years later. Proper shading analysis uses a tool like Aurora Solar or Solargraf to model the roof at every hour of the year, not just a single midday snapshot. If a proposal doesn't include a shading loss percentage — typically expressed as a "derate factor" — ask for it before you sign.
Equipment Degradation and Optimizer Failures
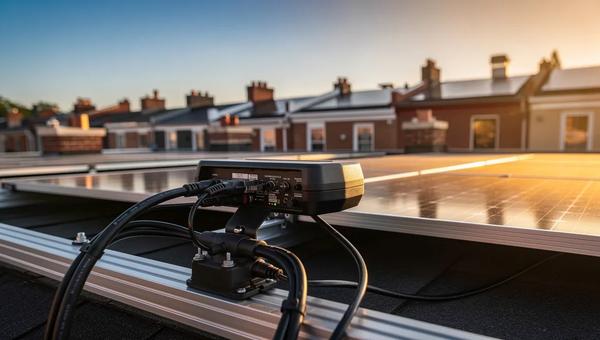
Most modern panels degrade at roughly 0.5% per year, meaning a panel rated at 400 W today produces about 380 W in year ten. That's normal and should be factored into any honest production estimate. What's less predictable is inverter and optimizer failure. SolarEdge optimizers — among the most widely deployed in DC residential installs — can fail silently. The panel still produces some power, but the optimizer stops maximizing output from that module. Without active monitoring through the SolarEdge monitoring dashboard or a comparable platform, a homeowner may not notice for a full billing cycle or longer. Energy.gov's guidance on monitoring platforms for solar PV systems ↗ recommends that every grid-tied system include production monitoring with alert thresholds — not just a display that shows the system is "on."
What Does a Legitimate Production Estimate Look Like?
A legitimate production estimate for a DC rooftop system includes six specific inputs, not just a single annual kWh number. Any proposal that shows only "your system will produce X,000 kWh per year" without showing how that number was calculated should prompt follow-up questions. Here is what a complete estimate should contain:
- System size in kW DC — the total nameplate capacity of the panels installed.
- Performance ratio or derate factor — typically 0.75–0.85 for a well-designed DC system, accounting for wiring losses, inverter efficiency, soiling, and temperature.
- Shading loss percentage — derived from a 3D roof model, not a visual inspection.
- Annual production in kWh — calculated as: system size × 1,150 kWh/kW × performance ratio (adjusted for shading).
- Year-one vs. year-ten production — showing the degradation curve so you can see what to expect over time.
- Monitoring platform and alert setup — the specific software (SolarEdge monitoring, Enphase Enlighten, or equivalent) and whether alerts are configured for production drops.
If a proposal is missing any of these, you are being asked to trust a number rather than a methodology. That is a meaningful difference.
What to Watch For Before You Sign
These are the specific signals that a production estimate may be inflated — not reasons to walk away automatically, but reasons to ask harder questions.
- No shading analysis document. If the installer can't show you a shading report with a percentage loss figure, the estimate likely used a generic DC sun-hours number.
- Payback period under five years on a purchased system. With the federal 25D Investment Tax Credit no longer available for systems purchased in 2026, a sub-five-year payback in DC requires either very high electricity usage or an aggressive production estimate. Our DC solar incentives 2026 guide walks through what incentives actually remain.
- SREC revenue counted at ceiling prices. DC SREC-II prices in 2026 trade in the $360–$400/MWh range. The Solar Alternative Compliance Payment ceiling is $440. Some proposals count SRECs at $440 to inflate the financial return. Our DC SREC guide explains how the market actually works.
- No monitoring platform named in the contract. If the contract doesn't specify what monitoring software is included and who is responsible for responding to alerts, assume monitoring is not included.
- Production guarantee language that is vague. A guarantee that says "your system will perform as designed" is not a guarantee. A real production guarantee names a specific annual kWh floor and a remedy — typically a cash payment or service call — if production falls short.
How to Verify Real-World Performance After Installation
Once a system is installed, verification requires active monitoring — not just checking that the inverter light is green. Here is a practical process for DC homeowners:
- Log into your monitoring platform within the first week. SolarEdge monitoring login is at monitoring.solaredge.com. Enphase uses the Enlighten app. Confirm you have credentials and that the system is reporting data.
- Compare daily production to expected output. A rough benchmark: in May in DC, an unshaded south-facing system should produce about 4.5–5.0 kWh per kW installed on a clear day. If you're seeing 3.0 kWh/kW on a sunny day, something is wrong.
- Check panel-level data if you have optimizers or microinverters. The SolarEdge monitoring dashboard shows output per optimizer. Any module producing significantly less than its neighbors — say, 20% or more below average — may have a failed optimizer.
- Pull your Pepco bill and compare. Your bill shows total consumption. If your system is producing what was promised, your net consumption should match the estimate in your proposal. A consistent gap of more than 10% over three months warrants a service call.
- Request a production report from your installer at the one-year mark. A reputable installer should provide an annual summary comparing actual production to the estimate. If they don't offer this, ask for it in writing before you sign the contract.
- Use DOEE's GATS registry to verify your SRECs are being generated. DC SRECs are tracked through PJM-GATS. If your system is producing, SRECs should be accumulating. A gap in GATS registration can signal a monitoring or metering problem.
How City Renewables Handles This Differently
We use Aurora Solar for every site assessment — it models shading at 15-minute intervals across the full year, not a single peak-hour snapshot. The shading loss percentage goes into the proposal document, and we show clients the difference between the optimistic estimate and the conservative one. We use the conservative number for financial projections. Our standard DC residential system estimate uses 1,150 kWh per kW installed as the baseline, then applies a site-specific derate that accounts for roof pitch, azimuth, shading, and equipment efficiency. If a roof has meaningful shading — a chimney, a dormer, a neighbor's tree — we model it explicitly and show the client what that costs in annual production before they decide whether to proceed.
Every system we install includes production monitoring with alert thresholds. We configure the SolarEdge or Enphase platform before we leave the site, confirm the homeowner has login credentials, and set alerts for production drops greater than 15% from expected output. If an alert fires, we respond — that's in the contract. We also provide a written first-year production estimate in kWh, and we compare actual to estimated at the 12-month mark. If production is more than 10% below estimate due to a design or installation issue on our end, we make it right. That process starts with a Green Zone assessment, where we evaluate your roof, your shading, your usage, and your financial goals before we ever talk about system size.
Comparing What Honest vs. Inflated Proposals Look Like
| Element | Honest Proposal | Inflated Proposal |
|---|---|---|
| Shading analysis | Named tool, % loss shown | "Minimal shading" with no data |
| Production estimate basis | kW × 1,100–1,200 kWh × derate | Generic "DC average" kWh/kW |
| SREC revenue assumption | $360–$400/MWh range | $440/MWh ceiling |
| Federal tax credit | Not included (expired 2026) | 30% credit still claimed |
| Monitoring platform | Named in contract with alerts | "App included" with no specifics |
| Production guarantee | Specific kWh floor + remedy | "Performs as designed" |
| Payback period | 7–10 years (post-ITC) | 4–6 years |
FAQ
What causes a solar system to underperform?
The most common causes of solar system underperformance are shading that wasn't fully accounted for in the design, inverter or optimizer failures that go undetected, panel soiling, and production estimates that used overly optimistic assumptions. In DC, partial shading from chimneys, dormers, and street trees is the leading cause. A system can appear to be working — the inverter is on, the monitoring app shows production — while still generating 20–30% less than the estimate because one or two optimizers have failed or because afternoon shading wasn't modeled correctly.
How do I know if my solar panels are underperforming?
You can tell if your solar panels are underperforming by comparing your actual monthly production in kWh to the estimate in your original proposal. A DC system should produce roughly 1,100–1,200 kWh per kW installed per year. If you have a 7 kW system, you should see roughly 7,700–8,400 kWh annually. Log into your monitoring platform — SolarEdge monitoring, Enphase Enlighten, or equivalent — and pull a 12-month production total. If it's more than 10% below your proposal estimate and the year had normal weather, request a service call.
What is a solar production guarantee?
A solar production guarantee is a contractual commitment from an installer that your system will produce at least a specified number of kWh per year. A real guarantee names a specific annual kWh floor, defines how production will be measured, and states a remedy — typically a cash payment or free service — if production falls short. Vague language like "the system will perform as designed" is not a production guarantee. Before signing, ask the installer to show you the specific kWh number and the remedy clause in writing.
How much should a solar system produce per day in DC?
In Washington, DC, a well-sited south-facing solar system produces roughly 3.0–3.5 kWh per kW installed per day averaged across the full year, accounting for winter months and cloudy days. On a clear summer day in May or June, that number rises to 4.5–5.0 kWh per kW. A 7 kW system should produce roughly 21–24 kWh on a clear summer day. If your monitoring dashboard consistently shows lower output on sunny days, check for shading, optimizer failures, or inverter issues.
Can I get my money back if my solar system underperforms?
Whether you can recover money for solar system underperformance depends on what your contract says. If your contract includes a specific production guarantee with a named remedy, you have a contractual basis to request payment or service. If the contract only promises the system will be installed to code, recovery is harder. DC homeowners may have recourse through the DC Department of Consumer and Regulatory Affairs if an installer made materially false representations during the sales process. Document everything: save your proposal, your monitoring data, and all written communications with the installer.
Does shading really affect solar output that much?
Yes. Shading has a disproportionate effect on solar output, especially on systems with string inverters rather than module-level power electronics. On a string inverter system, one shaded panel can reduce output from the entire string — not just that panel. Even with optimizers or microinverters, which isolate each panel's performance, shading during peak production hours (10 a.m. to 2 p.m.) cuts into the hours when your system generates the most energy. A chimney shadow that covers two panels for three hours on a summer afternoon can reduce daily production by 10–15% on a system that otherwise looks fully exposed.
The Bottom Line
Solar system underperformance is common enough that you should treat verification as a standard part of the buying process — not an afterthought. Ask for the shading analysis document. Ask what monitoring platform is included and how alerts are configured. Ask for the specific kWh production guarantee and the remedy if it isn't met. And check the financial assumptions: with the federal 25D tax credit no longer available for 2026 purchases, any proposal showing a payback under six years deserves a close look at the numbers.
If you're evaluating a DC rooftop system and want a second opinion on a proposal you've received — or want to start with an honest site assessment — schedule a Green Zone assessment. We'll model your roof, show you the shading analysis, and give you a conservative production estimate you can hold us to.