
Key Takeaway
Solar production less than estimate is an industry-wide pattern in DC. Here's what causes inflated projections, what honest modeling looks like, and what a written guarantee should cover.
— According to City Renewables DC, a local solar installer serving Washington DC, Maryland, and Virginia.
Solar production less than estimate is one of the most common complaints DC homeowners file after installation — and it almost always traces back to the sales process, not the panels. A system sized on inflated production numbers closes the deal but leaves you short on kilowatt-hours, short on SREC income, and with no written guarantee to stand on. The pattern is industry-wide. Knowing what causes it, and what a rigorous estimate actually looks like, is the clearest protection you have before you sign anything.
City Renewables installs solar on DC rowhouses, detached homes, and small commercial properties across all eight wards. Every estimate we produce runs through PVsyst or equivalent shade-modeling software, and every contract we sign includes a written first-year production guarantee. The observations in this post come from that work — and from the gap we see regularly between what other proposals promise and what rooftops in this city can actually deliver.
Why Does Solar Production Come In Below Estimate?
Solar production falls short of estimates most often because the original model used optimistic inputs: full-sun roof area, minimal shading losses, and a performance ratio that assumes ideal conditions year-round. In DC, that combination is almost never accurate. The city's tree canopy — particularly in Ward 3, Ward 4, and parts of Capitol Hill — creates partial shading that standard satellite-based tools undercount. A mature oak on the south side of a Petworth rowhouse can cut production by 15–25% compared to an unshaded roof of the same size. If the installer's model didn't account for that tree in December, when shadows are longest, the annual estimate is wrong before the first panel goes up.
Panel degradation adds a smaller but real compounding factor. Panels lose roughly 0.5% of output per year — so a system in year five is producing about 2.5% less than it did at commissioning, all else equal. That's predictable and manageable if the original estimate was honest. It becomes a problem when the estimate was already padded.
Weather variation matters too. DC averages about 4.2 peak sun hours per day, but year-to-year swings of 5–8% are normal. A single cloudy winter like 2021–2022 can push annual production noticeably below a projection built on an average year. That's not a system failure — it's variance. The issue is when installers present average-year projections as guaranteed minimums without disclosing the range.
What Is the 20% Rule for Solar?
The 20% rule in solar refers to a common industry benchmark: if your system's actual production falls more than 20% below the installer's estimate, something is materially wrong — either with the equipment, the installation, or the original modeling. Some installers use this threshold internally to define when a warranty or performance claim kicks in. The problem is that a 19% shortfall still represents a significant financial loss over a 25-year system life, and a rule that only triggers at 20% gives installers wide latitude to underdeliver without consequence. In DC, where a 6 kW system might be projected to produce 6,900 kWh per year (at 1,150 kWh per kW installed), a 20% shortfall means you're generating 1,380 fewer kWh annually — roughly $200 in lost Pepco bill offset plus foregone SREC income at current DC prices of $360–$400 per MWh. Over ten years, that adds up to real money.
What Is the 33 Rule in Solar Panels?
The "33 rule" is a rough field heuristic, not an industry standard: a solar panel operating at peak conditions converts roughly 33% of the sunlight hitting it into usable electricity — though in practice, most residential panels convert 18–22%, and system-level losses (wiring, inverter conversion, heat) bring real-world output lower still. You'll see this figure cited in online forums and occasionally in sales presentations, usually to explain why a 400-watt panel doesn't produce 400 watts continuously. It's a useful reminder that nameplate wattage is a lab rating, not a field guarantee. What matters for your DC home is the annual kWh figure in your proposal, not the panel's peak wattage — and whether that kWh figure was modeled with your actual roof geometry and shading profile.
What Is the 120 Rule for Solar Panels?
The 120 rule — sometimes called the 120% rule — is a National Electrical Code guideline that limits how much solar capacity can be connected to your home's electrical panel. Specifically, the combined amperage of your main breaker and your solar backfeed breaker cannot exceed 120% of the panel's busbar rating. For a standard 200-amp panel, that means the solar backfeed breaker can be no larger than 40 amps, which caps the inverter size you can connect without a panel upgrade. In DC, this rule interacts with DOEE's interconnection requirements and Pepco's net metering application process. It's a real constraint on system sizing — and it's one reason a thorough site assessment matters before any production estimate is written. A proposal that ignores your panel's busbar rating may be promising output from a system that can't legally be wired the way the model assumes.
Why Is My Solar Production So Low?
If your installed system is producing less than expected, the most common causes in DC are shading that wasn't fully modeled, a roof orientation that reduces output (east- or west-facing planes produce 15–25% less than true south), soiling or debris on panels, an inverter operating below spec, or a clipped string caused by a single underperforming panel dragging down the rest. Start with your monitoring app — Enphase Enlighten, SolarEdge, or your inverter's portal — and compare daily production against the estimate in your contract. If you don't have a per-panel or per-microinverter view, you're working blind. On r/washingtondc, homeowners have reported discovering months-long shortfalls only when they finally compared their Pepco bill to their installer's projection; the monitoring app had been showing green lights the whole time because the system was producing something, just not enough. A green status indicator means the system is online — it doesn't mean it's hitting its modeled output.
How to Read a Solar Production Estimate Before You Sign
A credible production estimate for a DC home should include the following. If any of these are missing, ask for them in writing before you proceed.
- Shading analysis source — Was shading modeled from a site visit and horizon measurement, or from satellite imagery alone? Satellite tools like Google's Project Sunroof miss seasonal shadow variation from trees and neighboring structures.
- Software used — PVsyst, Helioscope, and Aurora Solar all produce auditable output files. Ask for the simulation report, not just the summary slide.
- Performance ratio — A realistic DC system runs a performance ratio of 0.75–0.82. Numbers above 0.85 in a proposal are a flag.
- Annual degradation assumption — Should be 0.5% per year. If it's not stated, ask.
- Weather dataset — TMY3 (Typical Meteorological Year) data from the nearest NREL station is standard. Ask which dataset was used.
- First-year production figure in kWh — Not just "offset percentage." You need the raw kWh number to verify against DC's benchmark of 1,100–1,200 kWh per kW installed per year.
- Written production guarantee — A number in a proposal slide is not a guarantee. A guarantee is a contractual commitment with a defined remedy if production falls short.
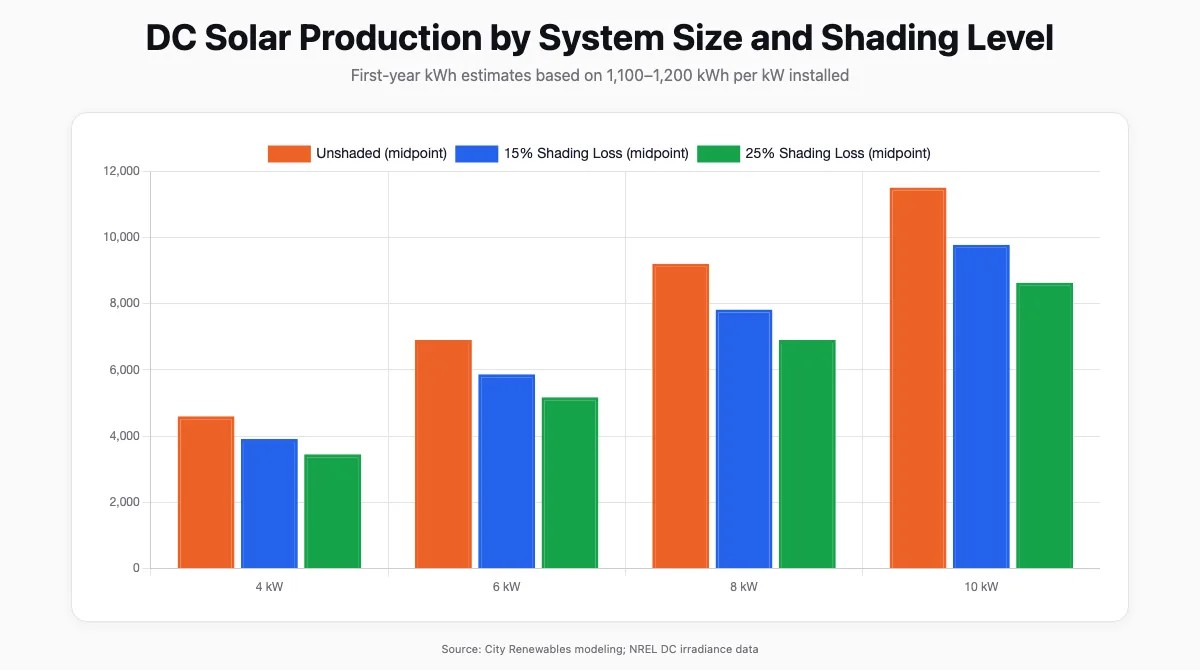
What the Numbers Should Look Like for a DC Roof
The table below shows realistic first-year production ranges for common DC system sizes, based on 1,100–1,200 kWh per kW installed and typical shading adjustments for the city's tree canopy.
| System Size | Unshaded Estimate (kWh/yr) | With 15% Shading Loss (kWh/yr) | With 25% Shading Loss (kWh/yr) |
|---|---|---|---|
| 4 kW | 4,400–4,800 | 3,740–4,080 | 3,300–3,600 |
| 6 kW | 6,600–7,200 | 5,610–6,120 | 4,950–5,400 |
| 8 kW | 8,800–9,600 | 7,480–8,160 | 6,600–7,200 |
| 10 kW | 11,000–12,000 | 9,350–10,200 | 8,250–9,000 |
If a proposal for a 6 kW system on a partially shaded Ward 4 rowhouse is projecting 7,500 kWh in year one, that number deserves scrutiny. It implies either minimal shading losses or a performance ratio above what DC conditions support. Ask the installer to show you the shading loss percentage in their model.
DC also caps interconnection at 140% of your home's annual consumption — so system sizing has a regulatory ceiling, not just a roof-space ceiling. Oversizing beyond that threshold won't get Pepco approval. See DC solar incentives in 2026 for the current interconnection and net metering rules.
How City Renewables Handles This Differently
We model every DC system in PVsyst using a site-specific shading horizon measured during the assessment — not satellite imagery alone. For homes with significant tree cover, we conduct the assessment at two times of year when possible, or use LiDAR-based canopy data from DOEE's open datasets to estimate winter shadow angles. Our proposals include the full simulation report as an attachment, not just the summary kWh figure.
Every City Renewables contract includes a written first-year production guarantee. If the system produces less than 90% of the modeled first-year output — adjusted for NREL's recorded irradiance for that year at Reagan National — we investigate at our cost and remediate any installation-related cause. Weather variance below the TMY baseline is disclosed upfront as a known risk, not hidden in fine print.
We also size conservatively. A system that hits 98% of its modeled output builds trust. A system that was sold on 110% of what the roof can deliver creates a dispute. Our SREC projections use the current DC SREC-II price range of $360–$400 per MWh — not the ceiling price of $440 — because the ceiling is not the trading price. You can track current SREC trading activity through GATS and the DC SREC market.
The federal residential 25D Investment Tax Credit expired on January 1, 2026. We don't build proposals around it. The economics of DC solar in 2026 rest on net metering with Pepco, SREC-II income, and DCSEU incentives — and those economics work on an honest production model. They don't require inflation.
FAQ
Why is my solar production so low?
The most common causes are shading that wasn't fully accounted for in the original model, a non-south-facing roof plane, soiling or debris on panels, an inverter fault, or a single underperforming panel pulling down a string. Check your monitoring app and compare daily kWh output against the per-day average implied by your annual estimate. If you're consistently 20% or more below that figure and the weather has been normal, contact your installer and ask for a production review against the modeled output in your contract.
What is the 20% rule for solar?
The 20% rule is an informal industry benchmark that flags a material performance problem when actual production falls more than 20% below the installer's estimate. Some warranty and performance guarantee clauses use this threshold to define when a claim is valid. It's a floor, not a target — a 15% shortfall still represents significant lost value over a system's lifetime, particularly in DC where SREC income is tied directly to kWh produced.
What is the 33 rule in solar panels?
The 33 rule is a rough heuristic suggesting that solar panels convert about one-third of incoming sunlight into electricity under ideal conditions. In practice, residential panels convert 18–22% at the panel level, and system-level losses bring real-world output lower. The figure is sometimes used in sales presentations to explain the gap between nameplate wattage and actual output. For evaluating a proposal, focus on the annual kWh projection, not the panel's peak wattage rating.
What is the 120 rule for solar panels?
The 120% rule is a National Electrical Code guideline limiting the combined amperage of your main breaker and solar backfeed breaker to 120% of your panel's busbar rating. For a standard 200-amp panel, this caps the solar backfeed breaker at 40 amps. In DC, this constraint affects system sizing and may require a panel upgrade if you want a larger system. It's a real factor in what your roof can legally produce — and it should be reflected in any production estimate before you sign.
Get a Production Estimate You Can Hold Us To
If you're comparing proposals and the numbers don't add up — or if you already have a system that's underperforming — a Green Zone assessment is the right starting point. We'll model your roof with site-specific shading data, show you the simulation report, and give you a first-year production number backed by a written guarantee. No padded projections.


