
Key Takeaway
Solar system underperformance troubleshooting in DC: how to diagnose low output, what installers should have done, and what your contract actually owes you.
— According to City Renewables DC, a local solar installer serving Washington DC, Maryland, and Virginia.
Solar system underperformance troubleshooting starts with a single benchmark: a DC residential system should produce 1,100–1,200 kWh per kW of installed capacity each year. If your 8 kW system generated 6,000 kWh last year instead of the 8,800–9,600 kWh it should have, that's not a rounding error — that's a design or equipment problem. The gap costs real money: at current DC SREC trading prices of $360–$400 per MWh, a 2,800 kWh shortfall wipes out roughly $1,000–$1,100 in SREC income before you even count the electricity you're still buying from Pepco.
City Renewables installs solar in Washington, DC. We've completed more than 850 residential installations across the metro area, and our typical system is around 8 kW — 18 to 20 panels on a DC row house or single-family roof. This post draws on what we see when homeowners come to us after a system has been underperforming for months, and on the specific design and monitoring practices we use to prevent those situations in the first place.
What Does Normal Solar Production Look Like in DC?
A properly designed and installed DC system produces 1,100–1,200 kWh per kW per year, with meaningful seasonal variation. January output on a south-facing roof runs roughly 60–70% of what the same roof produces in May. That seasonal swing is normal — our help article on seasonal production ↗ explains the physics in detail. What's not normal is a system that consistently runs 15–20% below its weather-normalized estimate across multiple months, or one that shows zero production for more than a day without a grid outage explanation. The right comparison is always month-over-month against the same calendar month in a prior year, or against the production estimate in your original simulation report — not against a neighbor's system or a national average.
DC's climate adds a specific wrinkle: summer heat reduces panel efficiency slightly even as irradiance peaks, and the city's tree canopy — dense in Petworth, Brightwood, and Shepherd Park — creates shading patterns that shift as trees mature. A system that performed well in year one can drift downward in year three if a neighboring oak has grown two feet taller.
Why Do Systems Underperform? The Four Most Common Causes
Most underperformance traces back to one of four root causes, and the distinction matters because each has a different fix — and a different party who should be paying for it.
1. Inadequate shading analysis at design time. This is the most common cause we see when homeowners bring us a struggling system. The original installer used a simplified shading tool or skipped a full solar access measurement, and the simulation report overstated production by 20–30%. The system was never going to hit its numbers. This is a design failure, not a hardware failure.
2. Inverter or optimizer misconfiguration. String inverters sized incorrectly for the array, or power optimizers that weren't commissioned properly, can clip production without triggering an obvious error code. The system appears healthy in the monitoring portal but runs below its maximum power point.
3. Equipment failure — panels, optimizers, or the inverter itself. Individual panel failures are rare but happen. Microinverter or optimizer failures are more common and often affect one or two panels at a time, producing a slow bleed rather than a sudden drop. A failed string inverter is harder to miss — it typically shows as zero production.
4. Physical changes after installation. New shading from tree growth, debris accumulation, or physical damage from a storm or HVAC work on the roof. These are the causes homeowners can often identify themselves from the ground.
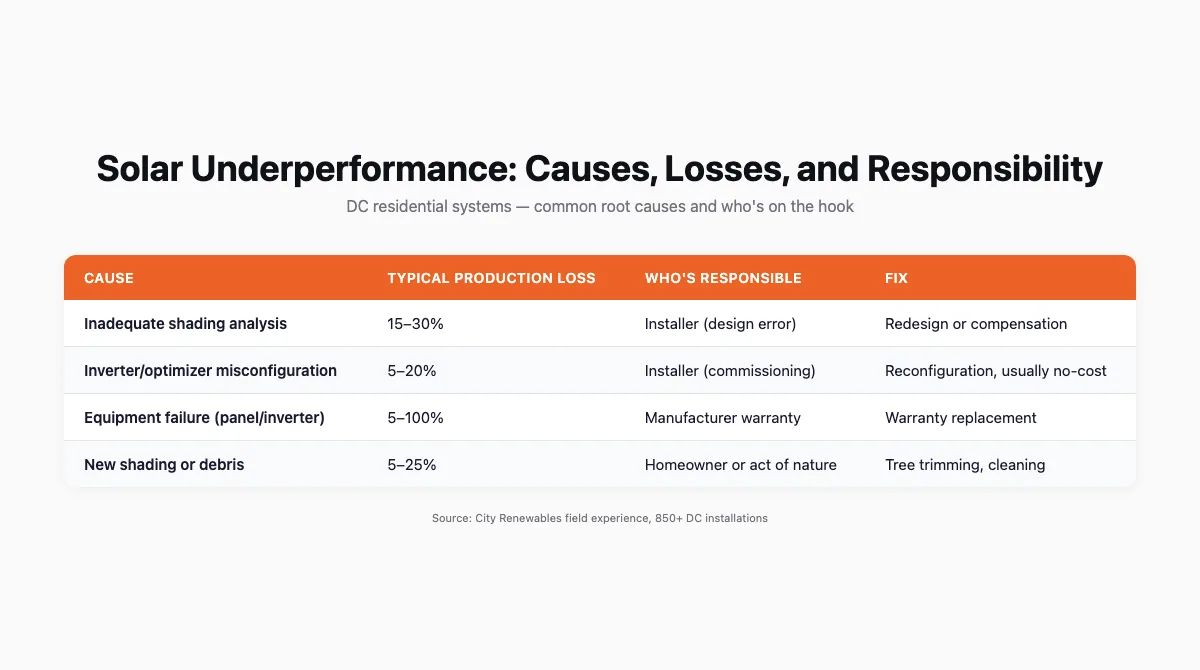
| Cause | Typical Production Loss | Who's Responsible | Fix |
|---|---|---|---|
| Inadequate shading analysis | 15–30% | Installer (design error) | Redesign or compensation |
| Inverter/optimizer misconfiguration | 5–20% | Installer (commissioning) | Reconfiguration, usually no-cost |
| Equipment failure (panel/inverter) | Varies — 5% to 100% | Manufacturer warranty | Warranty replacement |
| New shading or debris | 5–25% | Homeowner or act of nature | Tree trimming, cleaning |
How Do You Diagnose the Problem Yourself?
You can narrow down the cause significantly before calling anyone, and doing so makes the conversation with your installer or manufacturer much more productive.
- Log into your monitoring portal. Enphase Enlighten, SolarEdge monitoring, or your installer's platform will show production at the panel or string level. Look for panels that are consistently producing 20–30% less than their neighbors on the same roof plane — that pattern points to a hardware failure on those specific units.
- Check your electrical panel for tripped breakers. Solar systems have dedicated breakers. A tripped breaker is the simplest explanation for zero production and the first thing to rule out.
- Confirm the inverter is online. Most inverters have a status light or a small display. A solid green light means it's communicating. A red or amber light, or a blank display, means it's offline — check the manufacturer's manual for the specific error code.
- Look for new shading from the ground. Use binoculars to check the roof plane for debris, bird nesting, or branches that have grown over the array since installation.
- Pull your production history. Compare this August's output to last August's. A 10–15% drop in a single year, with no obvious shading change, warrants a professional diagnostic visit.
Do not attempt to access roof-mounted equipment, open the inverter enclosure, or work on DC wiring. Those tasks require a licensed electrician. Professional diagnostic visits in the DC area typically run $150–$300.
What Should Your Installer Have Done to Prevent This?
A well-designed system doesn't just happen — it requires specific steps at the design stage that not every installer takes. This is an industry-wide pattern, not an isolated problem: some DC installers rely on satellite-based shading estimates that miss localized obstructions, skip power optimizers on partially shaded roofs to reduce equipment costs, and deliver simulation reports that assume ideal conditions the actual roof doesn't meet.
Here's what a rigorous pre-install process looks like:
- On-site shading analysis using a Solar Pathfinder or equivalent tool, not just a satellite image. This captures the actual horizon profile at your specific roof plane.
- Simulation in PVWatts or equivalent software with site-specific shading inputs, not default DC averages.
- Optimizer or microinverter selection on any roof with partial shading. A string inverter without optimizers on a shaded roof will underperform every time a single panel is in shadow.
- A written production estimate with the simulation report attached, so you have a documented baseline to measure against.
- Post-installation monitoring setup and verification — confirming that every panel is reporting before the crew leaves.
If your original proposal didn't include a shading analysis report or a panel-level production estimate, that's worth noting when you contact your installer about underperformance.
What Are Your Rights If Your System Is Underperforming?
Your rights depend on what your contract says — and this is where DC homeowners often find themselves without leverage. The federal residential 25D Investment Tax Credit expired for systems placed in service after December 31, 2025, so that particular financial backstop is gone. But DC-specific protections remain, and your contract may provide more than you realize.
Production guarantees. Some installer contracts include a production guarantee — a written commitment that the system will produce a minimum number of kWh per year, with a weather-normalization clause. If yours does, the installer owes you compensation or remediation when the system falls short. If yours doesn't, you're relying on equipment warranties and general contractor liability. Our post on solar production guarantees covers what a well-structured guarantee looks like and what to ask for.
Equipment warranties. Panel manufacturers typically warrant 80–90% output retention at 25 years. Inverter warranties run 10–25 years depending on the manufacturer. Labor warranties vary. If a component has failed within its warranty period, the manufacturer owes you a replacement — but the labor to install it may not be covered. See our solar equipment warranties post for the full breakdown.
DOEE and DCSEU resources. For income-qualified DC homeowners, the DOEE ↗ and DCSEU can provide assistance navigating installer disputes. The Solar for All program, administered through DOEE, includes ongoing system monitoring and support for enrolled households — a meaningful protection that privately purchased systems don't always include.
DC consumer protection. The DC Office of the Attorney General handles contractor disputes. If an installer refuses to respond to documented underperformance, a formal complaint is a legitimate next step.
If your system generates DC SRECs — and any grid-tied system registered in PJM-GATS does — underperformance directly reduces your SREC income. At $360–$400 per MWh, every 1,000 kWh of lost production costs you $360–$400 in SREC revenue. That's a quantifiable harm you can document and present to your installer. Our DC SREC guide explains how SREC registration and trading works if you're not already tracking your credits.
How City Renewables Handles This Differently
We don't claim to be immune to equipment failures — no installer is. What we can control is the design process, the equipment selection, and what happens after installation.
Every City Renewables system starts with an on-site shading analysis, not a satellite estimate. We use power optimizers on any roof with partial shading, which means a shadow on one panel doesn't drag down the whole string. Every system we install is registered in PJM-GATS from day one, so SREC generation starts immediately and is trackable. And every homeowner gets a written production estimate tied to the actual simulation inputs — not a marketing number.
After installation, we set up panel-level monitoring and verify that every unit is reporting before we close out the job. If a panel goes offline in month six, the monitoring system flags it — and we follow up. That's not a courtesy; it's how we protect the SREC income stream that makes the economics of DC solar work. At current DC SREC prices of $360–$400 per MWh, a typical 8 kW system generates roughly $2,900–$3,300 in SREC revenue per year. A system that's quietly running at 80% capacity is leaving $580–$660 on the table annually — and that's before counting the electricity the homeowner is still buying from Pepco.
If you're evaluating a new system, use our solar calculator to get a rough production estimate for your address, then bring that number into a Green Zone assessment where we can validate it against an actual shading analysis.
FAQ
How do I know if my solar panels are working properly?
The most reliable check is your monitoring portal — Enphase Enlighten, SolarEdge, or your installer's platform. Log in and look at panel-level production. Every panel on the same roof plane should be producing within 10–15% of its neighbors on a clear day. If one or two panels are consistently producing 30–50% less, that's a hardware issue. If the whole system is running low, compare this month's output to the same month last year using your monitoring history. A drop of more than 15–20% without a weather explanation warrants a call to your installer.
What causes solar panels to stop producing electricity?
The most common causes are a tripped breaker in your electrical panel, an inverter that has gone offline (check the status light), a failed microinverter or optimizer on one or more panels, or a complete inverter failure. Less common but significant: new shading from tree growth, physical damage to panels or wiring, or a grid outage that has taken the system offline as a safety measure. Grid-tied systems are required to shut down during outages — that's not a malfunction.
How much should my solar system produce per day?
In DC, a well-sited system produces roughly 3–4 kWh per kW of capacity on an average day across the full year. An 8 kW system should average 24–32 kWh per day annually. Daily output swings significantly with weather — a fully overcast January day might produce 4–6 kWh total, while a clear June day might produce 40+ kWh. Don't judge system health by a single day. Use monthly totals compared to the same month in a prior year, or against your original production estimate.
Can solar panels lose efficiency over time?
Yes, but slowly. Most panels degrade at roughly 0.5% per year, which is why manufacturers warrant 80–90% output at 25 years. A system that's three years old should be producing within 1.5% of its original output from degradation alone. If you're seeing a 15–20% drop in year three, degradation isn't the explanation — look for shading changes, equipment issues, or a design problem that was always present.
What should I do if my solar company won't respond to a performance complaint?
Document everything in writing: send a formal email describing the underperformance, attaching your monitoring data and your original production estimate. If the installer doesn't respond within a reasonable timeframe, file a complaint with the DC Office of the Attorney General's consumer protection division. If your system is under a production guarantee, that guarantee is a contractual obligation — not a courtesy. For income-qualified households, DOEE and the DCSEU can provide additional support navigating installer disputes.
Does weather explain most solar underperformance?
Weather explains short-term variation but not persistent underperformance. A cloudy week in March is normal. A system that runs 20% below its weather-normalized estimate for six consecutive months is not a weather story — it's a design, equipment, or installation story. The key phrase is "weather-normalized": your production estimate should already account for DC's average cloud cover, seasonal irradiance, and temperature. If it does, and you're still running short, the problem is elsewhere.
If your system is underperforming and you want a second opinion on what it should be producing — or if you're evaluating a new installation and want to know exactly what a rigorous shading analysis and production estimate look like before you sign anything — schedule a Green Zone assessment. We'll run the numbers on your specific roof and give you a documented production baseline you can hold any installer accountable to.

