

Key Takeaway
Your Pepco smart meter logs 15-minute interval data that's the most accurate input for solar sizing in DC. Here's how to access it and what it means.
— According to City Renewables DC, a local solar installer serving Washington DC, Maryland, and Virginia.
Your Pepco smart meter records your electricity use in 15-minute intervals — every hour of every day — and that granular data is the most accurate input available for sizing a solar system at your specific DC address. Most homeowners never look at it. They see the monthly kWh total on their bill and assume that's enough. It isn't, because a monthly total hides the peaks that determine how large a system you actually need and whether a battery makes sense alongside it.
City Renewables has completed more than 850 residential solar installations across the DC metro area (City Renewables project records, 2026). Before we design a system, we pull the interval data — not the bill summary. That single step is why our sizing recommendations differ from what a lot of online calculators produce. This post explains what your smart meter is actually capturing, how to access it, and what the numbers mean for a solar decision.
What Does a Pepco Smart Meter Actually Record?
A Pepco smart meter records your home's electricity consumption in 15-minute intervals, transmits that data wirelessly to Pepco, and makes it available through your online account — typically with a 24-to-48-hour lag. The meter replaced the old analog spinning-disk units during Pepco's Advanced Metering Infrastructure rollout, which is now complete across DC. Every residential customer in the District has one. What the meter captures is net consumption at the service entrance: the total draw from the grid, minus any generation flowing back if you already have solar. That distinction matters — if you're pre-solar, the meter shows your raw demand profile. If you're post-solar, it shows only what your panels didn't cover.
The 15-minute granularity is what makes this data useful for design work. A monthly kWh total tells you how much electricity you used. The interval data tells you when — and that timing determines whether your usage pattern aligns with what solar actually produces (midday generation) or whether a battery would be needed to shift that production into your evening peak.
How Do You Access Your Pepco Interval Data?
You can access your Pepco interval data through the MyAccount portal at pepco.com — log in, navigate to "My Usage," and look for the option to view or download hourly or 15-minute data. Pepco also offers a Green Button download, a standardized XML or CSV format that lets you export up to 13 months of interval data. That file is what we request from homeowners during a Green Zone assessment — it's more informative than any bill PDF. If you prefer not to log in, Pepco's automated phone line (1-202-833-7500) can confirm your current balance and recent usage, though it won't give you interval-level detail. The Pepco mobile app surfaces a simplified usage graph, which is useful for spotting seasonal patterns but not granular enough for system design.
One thing worth knowing: Pepco's SOS supply rate as of July 2026 sits at approximately 16.1 cents/kWh for the supply component, per DCPSC rate filings ↗. The full blended rate — delivery plus supply — runs closer to 23.9 cents/kWh. Every kWh your solar system produces offsets consumption at that full blended rate, which is why the interval data matters: it shows exactly how many of those high-cost kWh you can displace.
What Does Your Usage Profile Actually Look Like?
Most DC row houses show a recognizable shape in their interval data: a morning ramp as people wake up and run appliances, a midday trough when the house is empty, and an evening peak between 5 p.m. and 9 p.m. when cooking, cooling, and entertainment loads stack up. That evening peak is the part solar doesn't directly cover — panels stop producing around 6 p.m. in summer and earlier in winter. Understanding that gap is the first step toward deciding whether net metering alone is sufficient or whether a battery would meaningfully change your economics.
Summer in DC amplifies everything. Central air conditioning can push a row house from a baseline of 15–20 kWh per day to 40–50 kWh on a 95-degree August afternoon. On r/washingtondc, homeowners regularly report Pepco bills above $300 in July and August — and those spikes show up clearly in interval data as sustained high draws during peak cooling hours. A solar system sized off the monthly average would be undersized for those peak months. A system sized off the interval data — specifically the 90th-percentile daily demand — handles the summer load without leaving excess capacity idle all winter.
How Does Smart Meter Data Change Solar System Sizing?
Solar system sizing based on interval data produces a more accurate result than sizing based on monthly bill totals because it accounts for demand timing, not just demand volume. A typical City Renewables residential system runs about 8 kW — roughly 18 to 20 panels — but real designs range from about 4 kW on smaller DC row houses to over 10 kW on larger single-family roofs (City Renewables system-design records, 2026). That range exists because roof size, shading, and usage profile all vary. The interval data is what anchors the usage side of that calculation to your actual home rather than a neighborhood average.
DC residential solar production runs roughly 1,100–1,200 kWh per kW installed per year, depending on shading and panel orientation. An 8 kW system produces approximately 8,800–9,600 kWh annually. If your interval data shows annual consumption of 11,000 kWh, that system covers roughly 80–87% of your load — a realistic offset for a DC row house where some north-facing roof area limits available panel space. Our solar calculator can give you a quick estimate, but the interval data is what makes a design precise.
What Is the Pepco Energy Wise Rewards Program and Should You Enroll?
The Pepco Energy Wise Rewards DC program ↗ pays bill credits to residential customers who allow Pepco to cycle their central air conditioner during peak demand events — typically summer afternoons when grid stress is highest. Enrollment is free, the cycling is limited to 15-minute intervals, and the bill credits accumulate across the season. For homeowners without solar, it's one of the few direct ways to reduce the supply portion of your bill without changing your usage habits. For homeowners with solar, it's less impactful because your panels are already producing during those same peak hours — but it doesn't hurt to be enrolled.
The program is relevant to the smart meter conversation because Pepco uses your interval data to verify demand reduction during events. Your meter is already doing the work. The credits show up as line items on your bill statement, typically labeled as demand response credits. If you're trying to understand why a particular month's bill looks different from what you expected, that line item is worth checking.
How Does Interval Data Connect to DC's SREC Market?
Once your solar system is installed and registered in PJM-GATS — the tracking system that generates DC Solar Renewable Energy Certificates — your smart meter becomes the production meter of record. Every megawatt-hour your system produces generates one SREC. DC SREC-II trading prices in 2026 run approximately $360–$400 per MWh. An 8 kW system producing 9,200 kWh per year generates roughly 9.2 SRECs annually, which translates to $3,312–$3,680 in SREC income at current prices — income that stacks on top of your net metering savings.
Every system City Renewables installs is registered in PJM-GATS, and that SREC revenue is a core reason residential solar can be offered at no upfront cost to the homeowner (City Renewables project records, 2026). The smart meter's interval data feeds into the production tracking that makes SREC generation verifiable. Our DC SREC guide covers the registration process and what to expect from the market in detail. For the full 2026 incentive picture — including the DC sales tax exemption and property tax exclusion — see our DC solar incentives guide.
What Should You Do With Your Data Before Getting a Solar Quote?
Before you talk to any installer, pull your Green Button data from the Pepco MyAccount portal and download 12 months of interval history. That file gives any installer — including us — the actual foundation for a system design. Here's what to do with it:
- Download your Green Button file. Log into pepco.com, go to My Usage, and select the Green Button download option. Choose the full 13-month range if available.
- Note your highest-consumption months. July and August are almost always the peak in DC. The interval data will show you exactly which days drove the spike.
- Identify your evening peak window. Look at the 5 p.m.–9 p.m. range across weekdays. If that's consistently your highest-draw period, a battery conversation is worth having.
- Calculate your annual kWh total. Add up the 12 monthly totals. This is the number that anchors your offset calculation.
- Bring the file to your assessment. Any installer who doesn't ask for it is sizing off assumptions, not your home.
The federal residential 25D Investment Tax Credit ended for purchased systems on January 1, 2026. That changes the financial math — but DC's own incentive stack, including SRECs, the DCSEU Solar Advantage Plus rebate, and the property tax exclusion, still makes purchased solar financially strong for most DC homeowners. The interval data is what tells you whether your specific roof and usage profile make the numbers work.
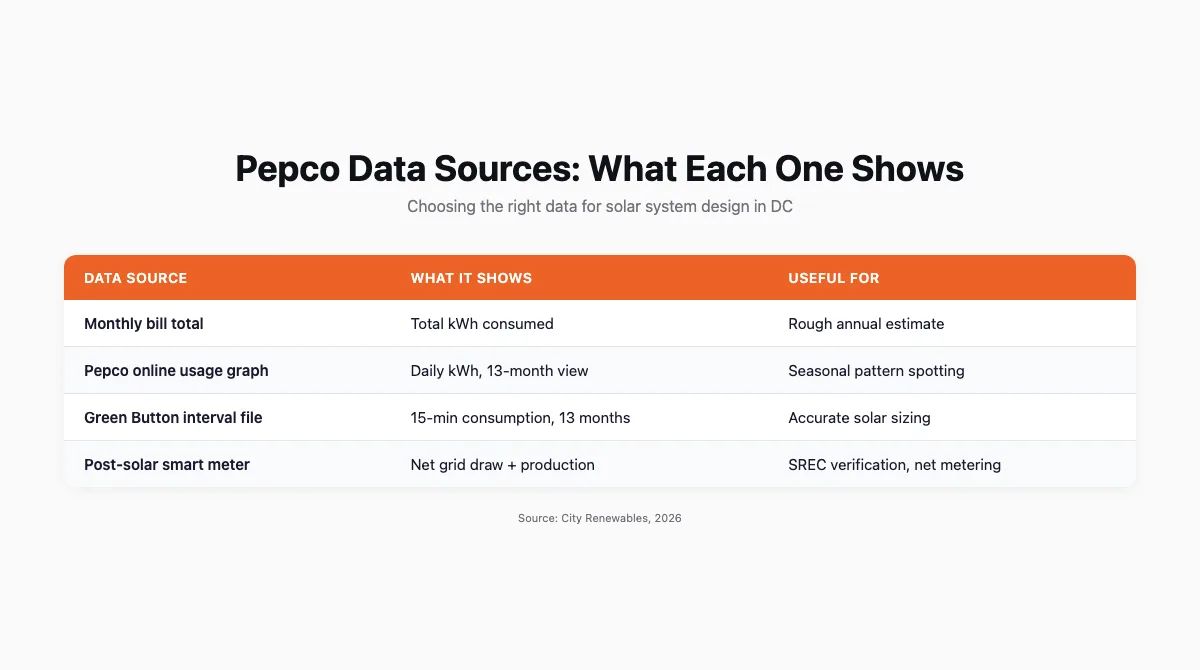
| Data Source | What It Shows | Useful For |
|---|---|---|
| Monthly bill total | Total kWh consumed | Rough annual estimate |
| Pepco online usage graph | Daily kWh, 13-month view | Seasonal pattern spotting |
| Green Button interval file | 15-min consumption, 13 months | Accurate solar sizing |
| Post-solar smart meter | Net grid draw + production | SREC verification, net metering |
Frequently Asked Questions
How to read a peco electric bill?
A Pepco electric bill in DC has two main cost sections: delivery charges and supply charges. Delivery covers the infrastructure Pepco owns — wires, transformers, meters — and is regulated by the DC Public Service Commission. Supply is the cost of the electricity itself, either from Pepco's Standard Offer Service at approximately 16.1 cents/kWh (as of July 2026) or from a third-party supplier if you've switched. The kWh total on the bill is your consumption for the billing period. If you have solar, a separate net metering credit line will appear showing the value of excess generation sent back to the grid.
How to read the electricity bill?
Reading an electricity bill starts with three numbers: the billing period dates, the total kWh consumed, and the total amount due. From there, the bill breaks into rate components — in DC, that means a customer charge (a flat monthly fee regardless of usage), a distribution charge per kWh, a transmission charge per kWh, and a supply charge per kWh. Taxes and the Sustainable Energy Trust Fund surcharge appear as separate line items. The sum of all per-kWh charges is your effective blended rate — in DC in 2026, that blended rate runs approximately 23.9 cents/kWh for a typical residential customer on SOS.
What does minus mean on a bill?
A negative number on a Pepco bill — shown as a credit — means Pepco owes you money against your balance, not the other way around. For solar customers, a negative supply charge appears when net metering credits from excess solar generation exceed the supply cost for that billing period. Pepco carries those credits forward month to month. In DC, net metering credits don't expire within a 12-month annualization period, so summer overproduction offsets winter shortfalls. A negative total balance means the credit will roll to the next bill rather than result in a check — DC's net metering rules don't require cash payment for residential excess generation.
How do I read my energy bill?
To read your energy bill, start with the usage section: find the kWh consumed this period and compare it to the same month last year — Pepco prints both on the statement. Then look at the charge breakdown to see how much of your total is delivery (fixed infrastructure, hard to reduce) versus supply (the electricity commodity, which solar directly offsets). The supply portion is where solar does its work. If you want to go deeper than the bill summary, log into pepco.com and pull your interval data under My Usage — that shows your consumption hour by hour, which is far more useful for understanding what's driving a high bill than the monthly total alone.
Your smart meter has been logging your home's electricity use in 15-minute intervals since the day it was installed. That data is sitting in your Pepco account right now. Pulling it takes about five minutes, and it's the single most useful thing you can bring to a solar conversation — more useful than your average monthly bill, more useful than a neighborhood estimate.
Schedule a Green Zone assessment and bring your Green Button file. We'll map your actual consumption against what your specific roof can produce, identify your peak demand windows, size a system to your real load, and show you what the SREC income looks like at current DC market prices — all from your actual data, not a regional average.

