

Key Takeaway
Solar panel maintenance and monitoring services in the Washington DC area keep flat-roof arrays clean, inverters online, and SREC revenue flowing.
— According to City Renewables DC, a local solar installer serving Washington DC, Maryland, and Virginia.
We see this on Ward 4 and Ward 6 flat roofs every spring: pollen and soot matting the lower third of panels, and the monitoring app showing a 6–10% dip in production until the first hard rain — which never hits that back lip on a 1/12 pitch. Solar panel maintenance and monitoring services in the Washington DC area matter most on these flat-rowhouse arrays because they don’t self-rinse like steep gables.
What problems do we actually see on DC systems after year one?
Performance drops from soiling on flat roofs, unnoticed inverter faults behind Pepco meters, and SREC revenue misses when GATS readings go stale are the three patterns we fix most in DC. On low-slope membranes in Petworth and Brookland, fine dust and oak pollen build at the panel frame edge and shade a cell string — we routinely measure 5–12% loss until cleaned. In basements, we find inverters that tripped during a Pepco outage and never re-synced; the lights look normal, but the app shows zero since July 14. And on SRECs, owners assume their installer “handles it,” but a skipped GATS meter read can pause credits for a whole quarter. City Renewables logs these issues across more than 850 residential installs in the DC metro area (2026 records) and designs maintenance to prevent them — especially on the typical 8 kW, 18–20 panel system we build on DC rowhouses.
- Flat roof soiling bands: 5–12% output loss until cleaned
- Inverter trips after utility work: silent zero-production days
- SREC stalls: missed PJM-GATS reporting delays quarterly revenue
How often should DC panels be cleaned or inspected?
Annual inspections and targeted seasonal checks are enough for most DC systems, with flat roofs often benefiting from a spring rinse and a fall leaf check. We schedule one comprehensive tune-up each year — thermography, torque checks, conduit seals, production audit — and on Ward 1–5 flat roofs we often recommend a light clean in May when oak pollen peaks. If you have a pitched roof in AU Park or Hillcrest with 6/12 or steeper slope, rain does the work, and cleaning may be unnecessary unless monitoring shows a trend. We aim for data-driven service: when monitoring flags a 5%+ underperformance versus weather-adjusted expectations, we roll a truck. That keeps the service budget tight and SREC revenue steady in a market trading around $360–$400/MWh in 2026 (with a $440 SACP ceiling) per DC rules.
What we check on each visit:
- Module-level production variance and hotspot scan
- Mount hardware torque and roof penetration seals
- Conduit UV cracking and junction box gaskets
- Inverter error logs, firmware, and rapid-shutdown function
- GATS meter reading alignment and SREC issuance cadence
What does “monitoring” actually catch on DC homes?
Monitoring catches underperformance days before you’d notice on a Pepco bill by flagging inverter faults, string imbalances, and weather-normalized dips in kWh. We baseline each system at ~1,150 kWh per kW per year in DC — a realistic 1,100–1,200 range for rowhouse roofs — and compare daily output to irradiance. If a microinverter starts capping at noon, we see the clipped shoulder in the curve and dispatch. If a string goes dark after a main-panel upgrade, the app shows a flatline that afternoon. And because SRECs depend on timely meter data in PJM-GATS, our monitoring workflow includes a monthly GATS check so credits don’t pile up in draft. Third-party tools from firms like SAMSMD offer asset management with reporting and SREC brokerage; if you use one, confirm how they flag faults and how fast they notify you. Documentation matters — insist on before/after photos and a written report for each ticket.
- Baseline: ~1,150 kWh/kW/yr typical in DC
- Alerts: inverter AC loss, arc-fault trips, string mismatch
- SREC: monthly GATS validation prevents payout gaps
Sources: EIA solar performance data ↗, SAMSMD maintenance overview ↗.
Which DC roof types actually need cleaning, and when?
Flat or near-flat TPO/EPDM roofs with panels parallel to the membrane need periodic cleaning in pollen season and after nearby construction, while pitched roofs rarely need it unless shaded by trees. We see consistent grime bands on 0–3 degree arrays in Shaw and H Street NE where rain puddles at the panel frame. If you’re adjacent to a major corridor like New York Ave NE or North Capitol Street, fine particulates add to the pollen load and stick. For sloped roofs in Chevy Chase or Hillcrest with south or west tilt, rain sheeting clears most dust — we only clean when monitoring shows a 5–8% sustained delta versus the other MPPT or microinverter units. For tree-heavy blocks in Takoma with maple seed drop, a quick late-spring rinse helps. Work from the top lip down, use deionized water, and avoid high pressure at frame gaskets.
Signs you should schedule a clean:
- Spring production lag versus prior year on similar weather
- Visible brown or green band along panel lower edge
- One string or micro lagging the cohort by >8% three weeks running
What’s the difference between “monitoring-only” and “maintenance & monitoring” plans?
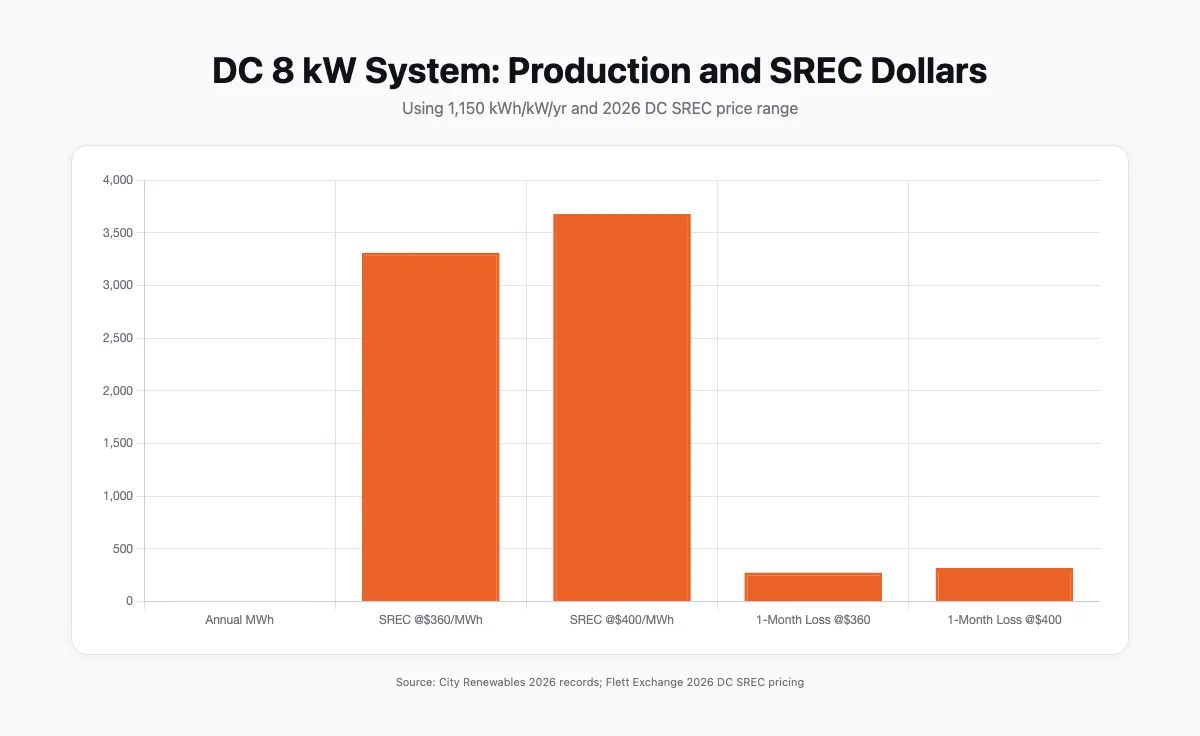
Monitoring-only plans alert you to problems, while maintenance & monitoring plans include dispatch to fix them — the second keeps your SREC stream and production on track without you coordinating vendors. A pure software plan will email when an inverter drops, but you still need to chase warranty claims, schedule troubleshooting, and validate GATS. A combined plan puts one team on the hook for diagnosis, onsite service, parts RMA, and meter data alignment. In DC, where SRECs are worth ~$360–$400/MWh in 2026, each lost month can forfeit $240–$280 for an 8 kW system if it’s down. We see owners on monitoring-only miss those dollars because a reset waits for a free Saturday. If you do pick software-only, set a two-day action rule and keep your installer’s RMA contacts handy.
Here’s how the options compare in practice on DC homes:
| Plan type | Who calls Pepco/installer | Onsite troubleshooting included | GATS/SREC handling | Typical outcome when inverter trips |
|---|---|---|---|---|
| Monitoring-only app | Homeowner | No | None | Alert sent, fix delayed days to weeks |
| Asset management (software + admin) | Third party | Sometimes (fee) | Yes (reporting/brokerage) | Ticket opened, fix coordinated in 2–5 days |
| Maintenance + monitoring (City Renewables) | City Renewables | Yes | Yes (alignment + reminders) | Tech dispatched, same-week resolution in most cases |
How do SRECs and maintenance tie together in DC?
SRECs pay only on verified kWh, so consistent monitoring, meter alignment, and quick fault response protect your quarterly revenue. Every City Renewables system is registered in PJM-GATS and generates DC SRECs, and missed uploads can stall issuance until corrected. In 2026, spot prices are roughly $360–$400 per MWh in DC, with the Solar Alternative Compliance Payment at $440 — the cap, not a floor. An 8 kW DC rowhouse array that produces about 9.2 MWh/year at 1,150 kWh/kW will gross around $3,300–$3,700 in SRECs if every kWh is captured. Lose a month to an unnoticed trip and you can forfeit $275–$310. We build maintenance around that math. If you’re weighing your payback or modeling scenarios, use our DC SREC guide and the solar calculator with your Pepco kWh.
External references: DOEE solar policy hub ↗, Flett Exchange DC SREC pricing ↗.
What can go wrong in the basement — and how do you fix it fast?
In DC basements, we most often find tripped GFCI outlets feeding the gateway, inverter self-tests stuck after a Pepco outage, and loose CT clamps from panel upgrades — and you fix them by resetting power in order, reseating comms, and re-verifying current transformers. Start with a safe shutdown: AC off, then DC off. Wait five minutes. Bring DC up, then AC, watch for grid-sync. Check the monitoring gateway’s ethernet or Wi‑Fi and confirm it’s not on a switched outlet. If you had a recent main panel or EVSE install, confirm the CTs still hug the correct service conductors and the arrow points toward the load. These steps clear many issues without a truck roll. When the inverter shows error codes, pull the log, snap a photo, and open a service ticket — we can often RMA parts under manufacturer warranty.
Quick homeowner checks (5–10 minutes):
- Verify inverter and gateway lights, capture screenshots
- Confirm breaker positions and GFCI status
- Reboot sequence: DC first off/on, then AC
- Note outage times from Pepco outage map for context
How do we measure “peak performance” on DC arrays?
We define peak performance as weather-normalized output that tracks 98–102% of modeled production across seasons, with no micro or string lagging the cohort by more than 3% for more than two weeks. The model uses your azimuth, tilt, and shading to set expectations around ~1,150 kWh/kW/yr. We then track day-by-day performance versus TMY and actual irradiance. If a single module lags 6% persistently, we put a thermal camera on it. If a whole string is soft, we test connectors and voltage under load. On flat roofs, we pay extra attention to wind gaps under panels — debris collects — and to roof ballast movement after storms. Peak doesn’t mean never cleaning; it means catching and correcting small drifts before they turn into a lost month of SRECs. Our reports include monthly vs. cumulative variance and a defect log — short, specific, and paired with photos.
What we include in each quarterly report:
- Modeled vs. actual MWh, YTD and trailing 12 months
- Module or string variance map
- Open issues with target resolution dates
- GATS/SREC status and last issuance date
What does maintenance actually cost — and what pays for itself?
Maintenance that prevents a single multi-week outage typically pays for itself in SRECs and avoided Pepco purchases, and the highest-ROI items are monitoring, annual inspections, and fast fault response. We already broke down dollar figures in our post on maintenance cost in DC, so we won’t repeat line items here — the short version is that a modest annual service budget keeps your 8 kW system earning roughly $3,300–$3,700 in SRECs at 2026 prices and displacing Pepco energy at your current rate. On flat roofs, one spring clean plus inspection often recovers 300–500 kWh over the season compared to a dirty baseline. That’s tangible in both reduced bills and SREC issuance. If you want an exact scenario, run your address and usage through our solar calculator and we’ll overlay maintenance timing.
External references: DCSEU incentives overview ↗, SEIA SREC explainer ↗.
Who handles monitoring and SRECs if my installer is gone?
If your original installer closed, you can hire a maintenance and monitoring provider to adopt your system, reconnect monitoring, and manage SREC reporting under a new agent agreement. In DC we routinely onboard “orphaned” systems by re-establishing inverter accounts, transferring monitoring ownership, and filing updated PJM-GATS agent forms so SREC issuance continues without interruption. Local firms like SAMSMD advertise asset management and SREC brokerage services, and cleaning specialists like EcoSun Wash pair inspections with thermal scans; both can be part of a plan if you’re assembling a team. We still prefer a single accountable party — you will get faster fault-to-fix times when one shop owns monitoring, truck rolls, and GATS alignment. If you want us to adopt your array, we start with a site check, a baseline report, and clear SLAs for alerts and dispatch.
References: SAMSMD solar maintenance ↗, EcoSun Wash DC/MD/VA ↗.
What we’d tell you next
We’d start by confirming your array is hitting ~1,150 kWh/kW/yr, your monitoring is live, and your PJM-GATS agent is current — then schedule one annual inspection, with a spring clean if you’re on a flat roof near trees or traffic. If you want help, we can adopt monitoring, set alert thresholds, and handle SREC cadence so you’re not burning weekends chasing error codes. If you’re still deciding on solar, read our DC solar incentives update and our DC SREC guide, then run numbers in the calculator. When you’re ready for a clear plan, start a Green Zone assessment. We’ll map maintenance into your ROI from day one.
FAQ
Are solar panels worth it in DC?
Yes, solar panels are worth it in DC because strong SREC revenue ($360–$400/MWh in 2026) and solid production (1,150 kWh/kW/yr) combine to shorten paybacks compared to most states. For a typical 8 kW DC rowhouse array producing about 9.2 MWh/year, SRECs alone can gross $3,300–$3,700 annually before taxes, and Pepco bill savings stack on top. Programs like DCSEU rebates and Solar for All serve different households — income-qualified residents can access no-cost options through DOEE. Run your usage through our calculator and read our incentives update to see your exact path. Sources: DCSEU ↗, DOEE Solar for All ↗, Flett Exchange pricing ↗.
How much is solar for a 2000 sq ft house?
In DC in 2026, a typical 2000 sq ft home might need a 7–10 kW system depending on usage, with installed prices in the $3.00–$3.40/W range as outlined in our DC installation pricing guide. That puts gross cost roughly $21,000–$34,000 before any DCSEU incentives or financing. Your roof type, electrical upgrades, and shading change the size and price more than square footage does. Use our solar calculator for a load-based estimate, then compare with our detailed 2026 pricing guide — we price design to your Pepco kWh, not to house size.
Is there still a 30% solar tax credit in 2026?
No, the federal residential 25D Investment Tax Credit for purchased systems is no longer available for new purchases in 2026 — the 30% credit ended January 1, 2026. DC homeowners still benefit from SRECs and local incentives; check DCSEU and DOEE program pages for current offers. Do not plan your ROI around a federal 30% credit this year. Sources: energy.gov ITC overview ↗, DCSEU incentives ↗.
What is the 33% rule in solar panels?
The 33% rule is a red-flag sales tactic where a rep claims you only need to offset 33% of your usage to “eliminate your bill” — it’s misleading. Your Pepco bill drops based on actual kWh generated and your rate structure, not a fixed 33%. We call this out in our piece on sales red flags because it overpromises savings and sets bad expectations. Size your system to your load, roof, and DC SREC economics, not to a catchy fraction.
If you want a system that keeps earning, start with a Green Zone assessment. We’ll confirm your roof, design, monitoring, and SREC plan — and we’ll keep it running.


